Background: Drawing Graphics
Throughout the rest of this book, we’ll need to display graphical
output. There are many different graphical toolkits available for
Python; the References section lists some of them.
For this book I chose one of the simplest: the turtle module.
My reasons for selecting it are:
turtleis included in the binary installers downloadable from python.org. No extra packages are required to use it.turtlecan be used for drawing with Cartesian coordinates by calling thesetposition()method, but the turtle primitives are also useful for constructing interesting examples. Most other toolkits only support Cartesian plotting.
Unfortunately the module doesn’t support printed output, but I think that isn’t much of a disadvantage because interactive graphics are more interesting for modern learners.
Turtle graphics are an approach with a long history. Originally the turtle was a physical object, a robot that could be placed on a large sheet of paper and directed to move. Then the turtle become a visual abstraction on a high-resolution screen, often represented as a triangle. Even in a purely graphical format, the concept of the turtle can make it easier to picture what actions are being carried out, and hence what a program is doing.
Approach
The turtle module provides an environment where turtles move
upon a 2-dimensional grid. Turtles have a position, a heading (the
direction in which the turtle is facing), and a variety of possible
states (turtles can draw lines in a particular colour when they move
or leave no trace) and actions (turning left or right; moving forward
or backward.
Here’s a brief overview of the functions and methods used in this
book. Consult Reference Card: Turtle Graphics when you need some help
remembering a method, and the Python Library Reference’s documentation
for the turtle module for a complete description of all the
module’s features.
(The module often has synonyms for the same action; I’ve chosen
the one I think is the clearest. For example, the methods
backward(dist), back(dist), and bk(dist)
all do the same thing, moving the turtle backwards. I’ve chosen
to use back(dist) consistently.)
You create a turtle by calling turtle.Turtle(). Doing this will
automatically pop
up a separate window (called a Screen)
on your computer’s display. You can call
turtle.Screen to get an object representing this window;
it has a few methods such as title()
to set the title, screensize() to get the size of the canvas,
and clear() to restore the screen’s contents
to their initial state.
A Turtle object has many methods that can be grouped into
families. There are methods for controlling the turtle’s motion:
forward(distance)moves the turtle forward distance pixels, in whatever direction the turtle is pointing.back(distance)moves backward distance pixels.left(angle)andright(angle)change the turtle’s orientation without moving it. By default angles are measured in degrees, but you can call the turtle’sradians()method to use radians in future calls toleft()andright().- The turtle’s movements aren’t normally performed instantly, but
instead are slowed down and animated so that the eye can follow what
the turtle is doing. You can change the speed of the turtle’s motion
by calling
speed(value), where value is a string giving a speed; “fastest” results in instananeous motion, and “fast”, “normal”, “slow”, and “slowest” are progressively slower speeds. - The turtle is usually drawn as an arrowhead. The
hideturtle()method prevents the turtle from being displayed, andshowturtle()brings it back.
To read the turtle’s position and heading:
pos()returns a tuple giving the (x,y) coordinate where the turtle is currently located.xcor()andycor()return just the X or Y coordinate.heading()returns the turtle’s heading, usually in degrees (but if you’ve previously calledradians()the result will be measured in radians).
To move the turtle to a particular coordinate and orientation:
setpos(x, y)moves the turtle to the given coordinate, drawing a line if the pen is down. You can also provide a pair of coordinates as a single argument.setheading(angle)sets the turtle’s orientation to angle. Usually 0 degrees is east, 90 is north, 180 is west, and 270 is south.home()returns the turtle to position (0,0) and resets its orientation to east.
The turtle can draw a line behind it as it moves. To control this line:
pendown()puts the pen down on the paper (metaphorically), so the turtle will leave a line as it moves.penup()raises the pen from the paper, so the turtle will move without leaving any trace.pencolor(color)sets the colour of the line traced. color is a string giving a primary colour name, such as “red” or “yellow”, or an RGB colour specification such as “#33cc8c”. (The database of colour names is limited, so specific names such as “crimson” or “octarine” won’t work, but simple names such as “red”, “blue”, and “green” are understood.)pensize(width)sets the width of the line traced. The width starts out as 1 pixel, but can be changed using this method.
The turtle can also stamp its image on the display:
stamp()records a copy of the turtle’s shape onto the canvas. This method returns an integer stamp ID, so that you can remove the image later by callingclearstamp()and passing it the ID.dot(size, color)draws a circular dot of the given size and colour. The colour is optional; if not supplied, the turtle’s current pen colour is used.- The turtle
reset()method clears all of the drawings made by that turtle and returns it to the home position.
Example
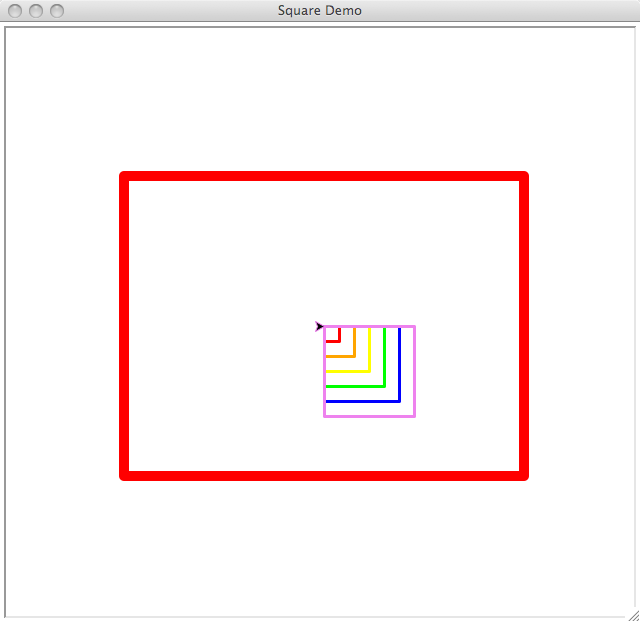
This program doesn’t exercise every single method – that would be tediously long – but it shows what turtle graphics are like by drawing some simple graphics and then waiting for a keypress before exiting.
1 2 3 4 5 6 7 8 9 10 11 12 13 14 15 16 17 18 19 20 21 22 23 24 25 26 27 28 29 30 31 32 33 34 35 36 37 38 39 40 41 42 43 44 45 46 47 48 49 50 51 52 53 54 55 56 57 58 59 60 61 62 63 64 65 66 67 68 69 70 | #!/usr/bin/env python3
import sys
import turtle
def border(t, screen_x, screen_y):
"""(Turtle, int, int)
Draws a border around the canvas in red.
"""
# Lift the pen and move the turtle to the center.
t.penup()
t.home()
# Move to lower left corner of the screen; leaves the turtle
# facing west.
t.forward(screen_x / 2)
t.right(90)
t.forward(screen_y / 2)
t.setheading(180) # t.right(90) would also work.
# Draw the border
t.pencolor('red')
t.pendown()
t.pensize(10)
for distance in (screen_x, screen_y, screen_x, screen_y):
t.forward(distance)
t.right(90)
# Raise the pen and move the turtle home again; it's a good idea
# to leave the turtle in a known state.
t.penup()
t.home()
def square(t, size, color):
"""(Turtle, int, str)
Draw a square of the chosen colour and size.
"""
t.pencolor(color)
t.pendown()
for i in range(4):
t.forward(size)
t.right(90)
def main():
# Create screen and turtle.
screen = turtle.Screen()
screen.title('Square Demo')
screen_x, screen_y = screen.screensize()
t = turtle.Turtle()
# Uncomment to draw the graphics as quickly as possible.
##t.speed(0)
# Draw a border around the canvas
border(t, screen_x, screen_y)
# Draw a set of nested squares, varying the color.
# The squares are 10%, 20%, etc. of half the size of the canvas.
colors = ['red', 'orange', 'yellow', 'green', 'blue', 'violet']
t.pensize(3)
for i, color in enumerate(colors):
square(t, (screen_y / 2) / 10 * (i+1), color)
print('Hit any key to exit')
dummy = input()
if __name__ == '__main__':
main()
|
The display resulting from this program is:
Code Discussion
One thing to learn from the demo program is that drawing functions
such as border() and square() should be careful about the
state of the turtle they expect at the beginning and the state it’s
left in afterwards. A frequent error is to leave the turtle pointing
in an unexpected direction, causing later actions to be carried out in
the wrong place. Watching the animated turtle usually makes such
mistakes apparent.
References
- http://cairographics.org/
- Cairo is a 2D graphics library with a Python API that supports both screen and printed output.
- “Turtle Geometry: The Computer as a Medium for Exploring Mathematics”
- By Harold Abelson and Andrea diSessa. A 1981 textbook that begins with polygons and ends with the curved spacetime of general relativity, using turtle graphics both to draw illustrative examples and as a conceptual model. ISBN 978-0-262-01063-4 (ISBN 978-0-262-51037-0 for the paperback).